Direct Mail Response Rates: 2026 Benchmarks From USPS Data
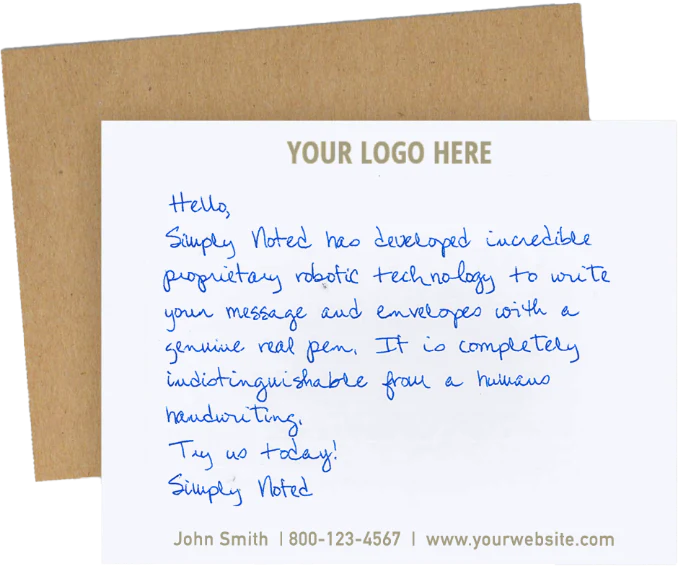
Simply Noted writes and mails real pen-and-ink cards for businesses. See our handwritten direct mail service →
Updated November 2026 with the USPS Household Diary Study for fiscal 2024 (published June 2025) and USPS results for fiscal 2025.
Quick answers
What is a good direct mail response rate? In the USPS Household Diary Study for fiscal 2024, recipients said they were considering a response to 15% of the advertising mail they received from businesses they already buy from, and to 2% of mail from businesses they had no relationship with. Across all advertising mail the figure was 9%. These are intentions recorded in household mail diaries, so treat them as a ceiling and measure your own campaigns.
Does handwritten direct mail get better response rates than printed mail? It usually gets more attention, because a hand-addressed envelope with a real stamp looks personal and gets opened rather than thrown out unread. Response still depends on your list, offer and timing, so measure it: every Simply Noted card carries a trackable QR code, and you can mail a test batch alongside your printed mail to compare results on the same audience.
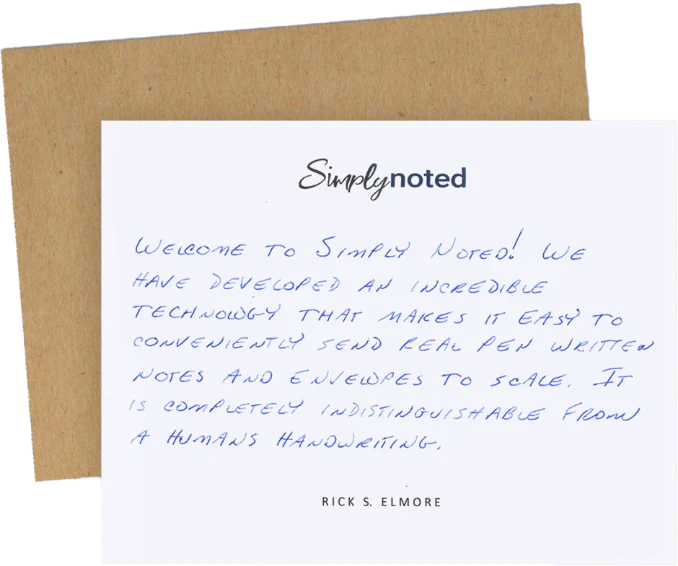
What's an alternative to printed direct mail that people actually open? Handwritten mail. A note written with a real ballpoint pen, in a hand-addressed envelope with a real stamp, looks like personal mail, so people open it instead of sorting it as junk. Simply Noted's 220+ robots write every note with a real pen, then address, stamp and mail it, triggered from your CRM, API, Zapier, Shopify or a CSV upload. A single card is $2.80 plus postage, and on the Unlimited plan ($497/month) note cards are $0.99 plus postage.
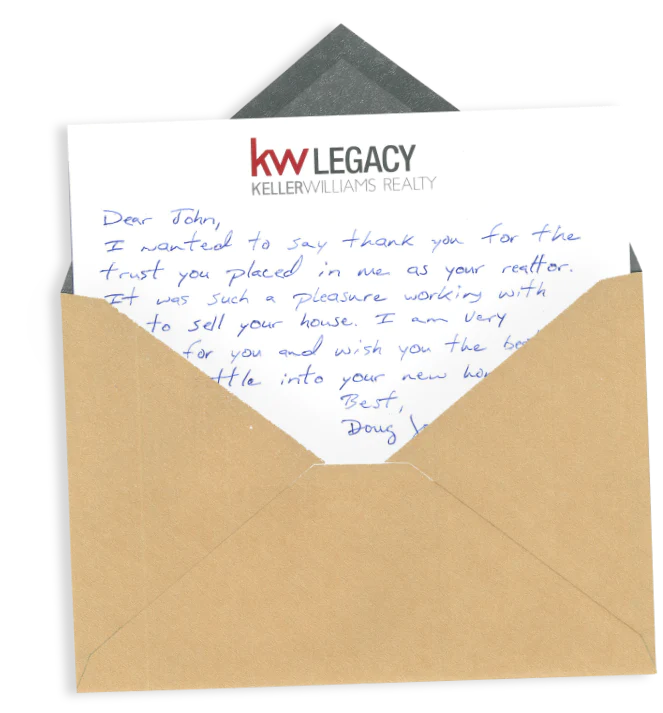
How do B2B sales teams use handwritten notes for prospecting? Sales teams send short handwritten notes where a personal touch stands out: a first touch to a target account, a thank-you after a demo or meeting, a follow-up on a stalled deal, and a thank-you for a referral. Simply Noted writes each note with a real pen and mails it, triggered from your CRM (HubSpot, Salesforce or Pipedrive through Zapier or our API) when a deal reaches a stage, so reps never write cards by hand. Every card carries a trackable QR code, so you can see which notes get a response.
Direct Mail Response Rate Benchmarks (USPS, Fiscal 2024)
The most current independent benchmark comes from the USPS Household Diary Study, which records the mail a national sample of households receives and what they do with each piece. The fiscal 2024 edition was filed with the Postal Regulatory Commission in June 2025.
| Who the mail went to | Read | Considering a response |
|---|---|---|
| Existing customers | 60% | 15% |
| Prospects (no past relationship) | 26% | 2% |
| All advertising mail | 44% | 9% |
Share of advertising mail pieces. Source: USPS Household Diary Study, fiscal 2024, Table 5.5.
What happens to advertising mail
One or more household members read 44% of the advertising pieces they received in 2024, close to the 45% of 2019 and the 47% of 2014. Another 22% were looked at but not read and 4% were set aside to read later, so 70% of advertising mail got at least some attention. The other 30% was thrown away unread.
Which senders do best
Merchants, much of whose mail is catalogs, had the highest reading and response rates. Financial senders had the lowest, which the study puts down to the volume of credit card solicitations they mail.
Campaign benchmarks from the ANA
For campaign-level response and ROI benchmarks by list and format, the ANA (Association of National Advertisers) publishes an annual Response Rate Report. The 2025 edition came out in July 2025 and requires a free ANA login. The public summary of its 2021 report put the best direct mail ROI at 112% for letter-size envelopes sent to prospect lists and 92% for postcards sent to house lists, against 93% for email and 102% for SMS.
Your House List Is the Biggest Lever
The gap between existing customers and prospects is the most useful number in the study. Mail from a business the recipient already knows was read more than twice as often (60% vs 26%) and was more than seven times as likely to prompt a response (15% vs 2%).
So before you buy a list, mail the people you already have: recent buyers, lapsed customers, referral sources and warm leads. Thank-you notes after a purchase, check-ins with customers who have gone quiet and follow-ups after a meeting all go to people who already recognize your name.
Why Mail Still Gets a Response
Neuroscience research explains part of it. In a 2015 study with Temple University's Center for Neural Decision Making, the USPS Office of Inspector General found that people processed digital ads faster, but spent more time with physical ads, had a stronger emotional response to them and remembered them better. Physical ads also produced more activity in the part of the brain tied to how much people value and want a product.
A 2015 Canada Post study with True Impact Marketing found that direct mail took 21% less cognitive effort to process than digital media. When participants were asked to recall the brand from an ad they had just seen, recall was 75% after a mail piece against 44% after a digital ad, 70% higher. Direct mail's motivation score was also 20% higher than digital's.
Less Mail in the Mailbox
There is also less competition for attention. USPS delivered 56.8 billion pieces of Marketing Mail in fiscal 2025, down 1.3% from the year before, while First-Class Mail fell 5% to 42.0 billion pieces.
Per household the decline is steeper. The average household received and sent 682 pieces of mail in 2024, 37% fewer than in 2014, and advertising mail per household fell 39% to about 410 pieces a year. Only 52% of households' bills and statements now arrive by mail, down from 77% in 2014.
Where Handwritten Mail Fits
Personal mail has become rare. In 2024 the average household received 3.4 letters or invitations from friends and family, 59% fewer than in 2014, and sent fewer than two personal letters all year. A hand-addressed envelope with a handwritten note inside now looks different from almost everything else in the mailbox.
We have not found an independent, published benchmark for handwritten mail response rates, so test it on your own list. Combine the two strongest levers in the data above: send to people who already know you, and make the piece look personal. Simply Noted's robots write every note with a real ballpoint pen, then address, stamp and mail it, and each note carries a trackable QR code so you can count responses. Mail a test batch alongside your printed piece to the same audience and compare the results.
For envelope-level results, see our handwritten address vs printed label response rate data, and for formats, costs and ROI, our guide to handwritten direct mail.
How to Measure Your Response Rate
Response rate = responses ÷ pieces delivered × 100. A campaign that delivers 1,000 pieces and gets 40 responses has a 4% response rate.
Give every piece a way to be counted: a QR code, a unique URL, a promo code or a dedicated phone number. Then calculate cost per response (total campaign cost ÷ responses), because a more expensive piece can still win if it earns enough extra responses. The cost-per-lead math in our handwritten direct mail guide shows the break-even point, and the direct mail ROI guide covers tracking revenue.
Ready to test handwritten mail on your best customers? See Simply Noted's handwritten direct mail service.
Sources
- USPS, The Household Diary Study: Mail Use & Attitudes in FY 2024 (filed with the Postal Regulatory Commission, June 2025)
- USPS, U.S. Postal Service Reports Fiscal Year 2025 Results (November 14, 2025)
- USPS Office of Inspector General, Enhancing the Value of Mail: The Human Response (RARC-WP-15-012, June 15, 2015)
- Canada Post, A Bias for Action (with True Impact Marketing, July 31, 2015)
- ANA, 2025 Response Rate Report (July 2025, free login)
- ANA, public summary of the Response Rate Report 2021 (January 2022)